Covid Isn’t Dead Yet — Unfortunately
The Financial Hangover
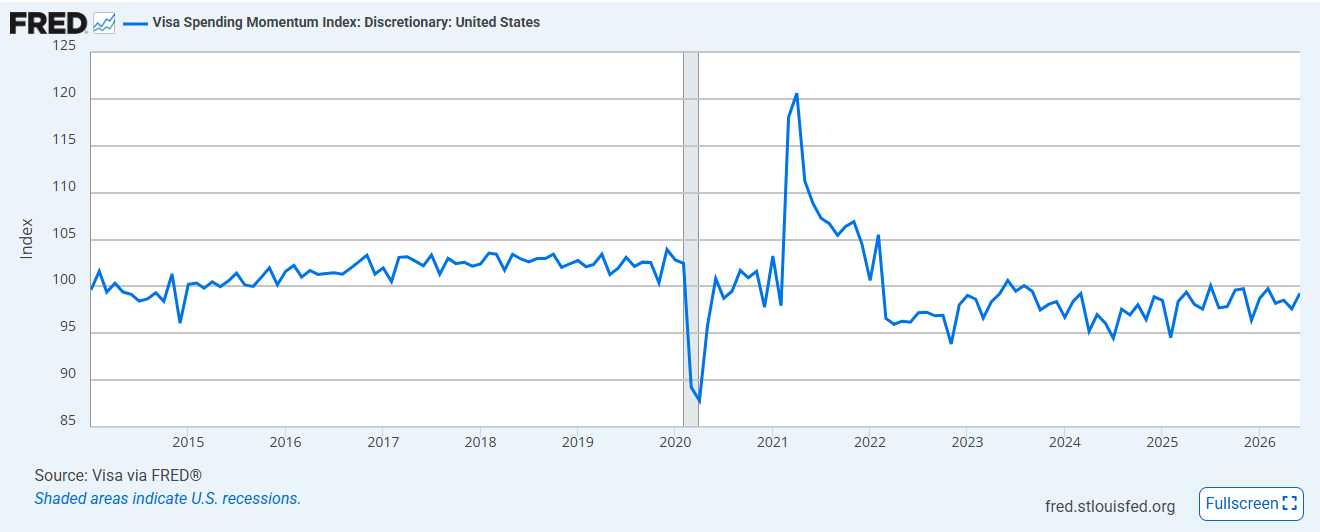
While the disease itself is mostly gone, the financial ramifications on families and businesses still prevail. The chart below is the Visa Discretionary Spending Momentum Index from the St. Louis Federal Reserve. What is notable in this picture is the level of consumer discretionary spending from 2014 to Covid (2020) and the level from 2022 to present. If you average those trend lines, one can see a drop from approximately 103 to approximately 96 from the two sides of the Covid divide — a difference any observer could readily discern.
Mortgage Rates
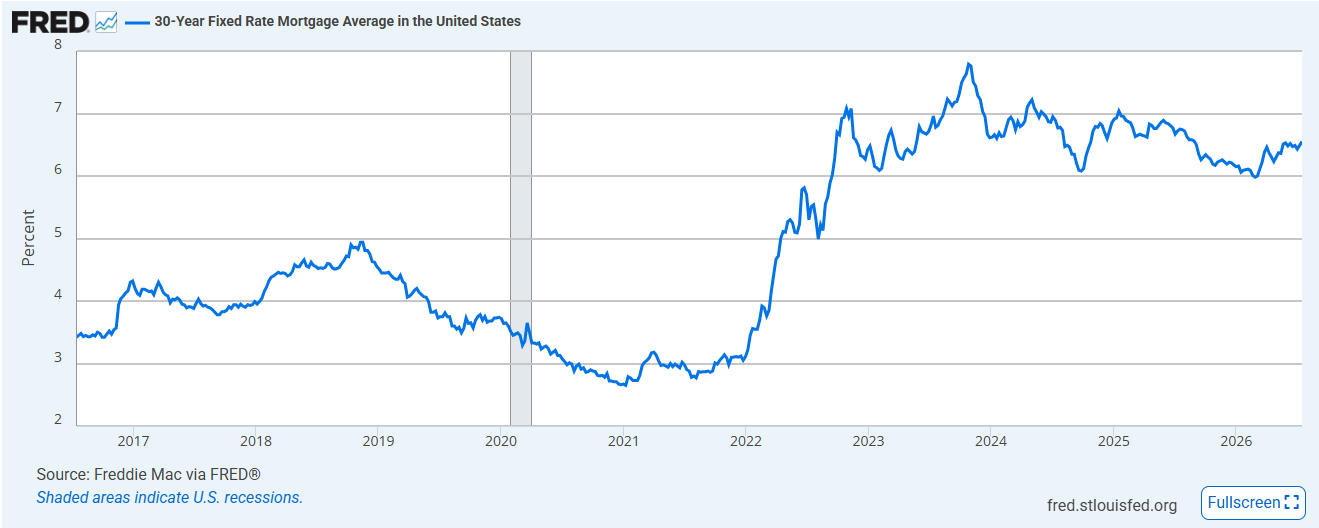
A look at 30-year average mortgage rates in the U.S. is graphed below. As you would surmise from just watching the nightly news, mortgage rates have risen dramatically since Covid.
Inflation
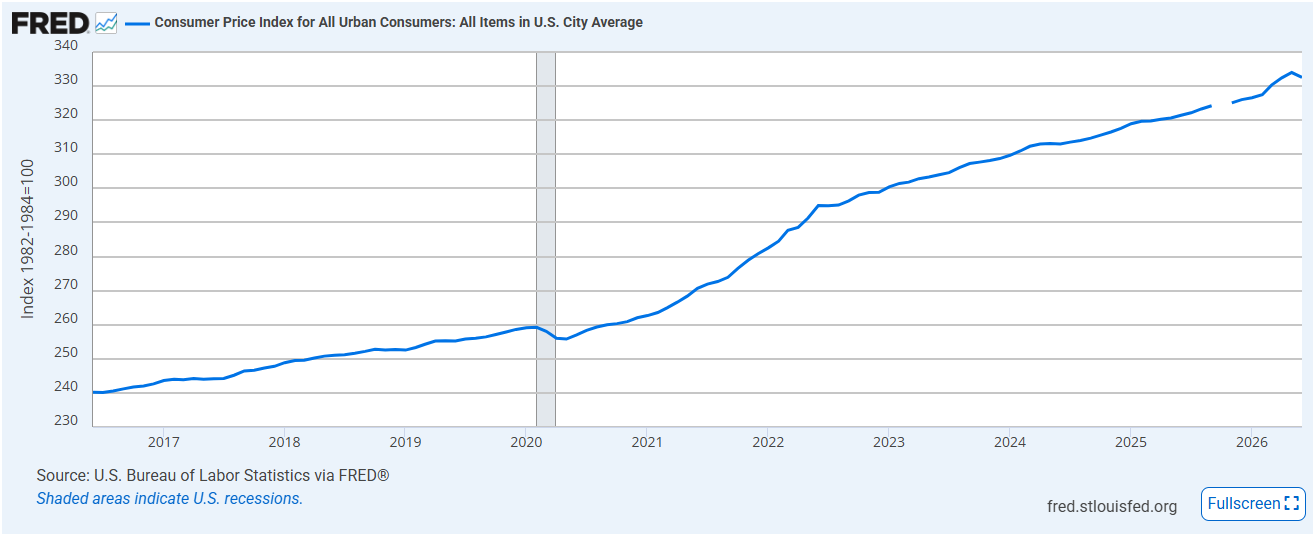
A graph of the inflation rate as measured by the Consumer Price Index for all items in U.S. cities reveals that costs have risen substantially. Inflation’s ugly head has been in the news since 2020 continually, with ongoing debate about whether the Federal Reserve should raise or lower rates to combat it.
Consumer Stress: Credit Card Delinquencies
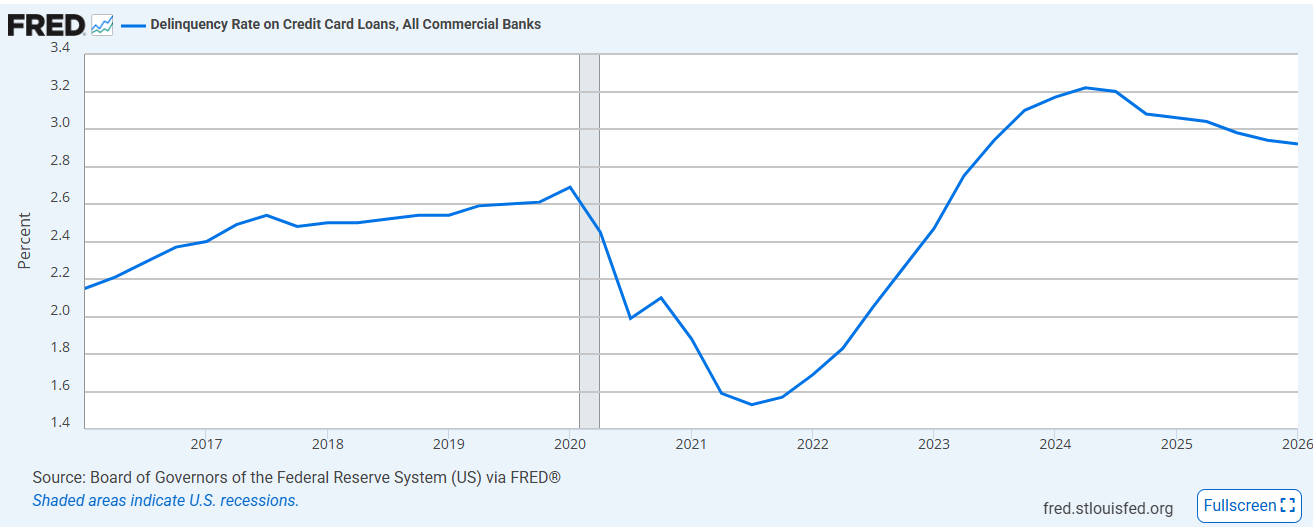
Lastly, delinquency rates on credit card loans have also risen since Covid, illustrating a sign of duress for the average consumer.
Structural Changes to the Economy
Overall, the legacy of Covid carries on with an uncomfortable persistence. Other structural takeaways involve a permanently altered worksite. Hybrid and remote working have become more the status quo. To support it, technology — such as Zoom — has grown substantially to connect remote workers with their organizations.
However, the greatest financial feature of Covid has been a more sustained market volatility regime due to inflation, elevated debt levels, and a quasi-mandatory supply chain redesign. Just-in-time inventory management is now firmly in the past.
The Loss of Institutional Trust
The worst of Covid — aside from the premature deaths, which are horrendously appalling in their own right — involves a loss of institutional trust across the country, and perhaps globally. Political polarization in the U.S. has reached historic highs since Covid, characterized not just by deep ideological divides but also by intense negative partisanship. This extreme polarization heavily influences political behavior, media consumption, and basic institutional trust across the country.
Divisions within the U.S. population on social and political issues have increased by 64% since 1988, with almost all of this coming after 2008. Starting in 2008 — the year of the financial crisis, Obama taking office, and the launch of Apple’s App Store and iPhone 3G — divisions across the board steadily rose. Most of this shift is down to the liberal side of the American public moving in a more progressive direction. The U.S. left was 31.5% more socially liberal in 2024 compared to 1988, while the U.S. right was only 2.8% more conservative.
Volatility: The Defining Risk — and the BlueFire Response
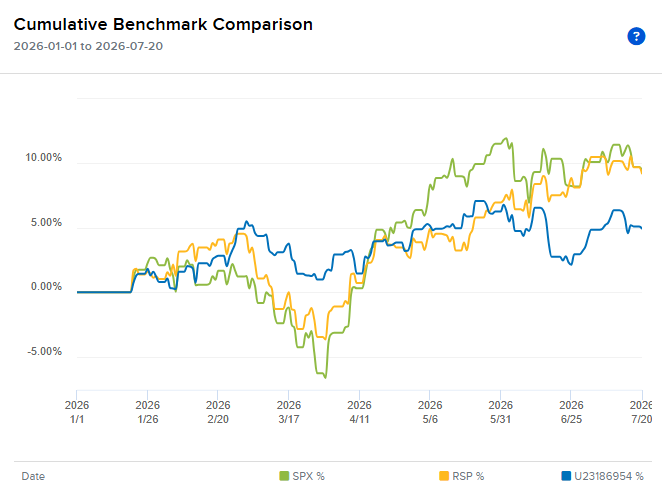
The consequence of all this flux across social and economic divides is, in a word, Volatility — with a capital V. Which is precisely what BlueFire’s investment strategy is designed to mitigate. By holding a well-diversified portfolio of equity assets at equal risk, we hold back the volatility drag on an investor’s capital, decreasing drawdowns and allowing investors to sleep soundly.
The graph below depicts the value of the S&P 500 (SPX; green), the Equal Weighted S&P 500 (RSP; yellow), and BlueFire’s Large Cap Fund, L.P. (U23186954; blue) year-to-date. What you can visualize easily is the lower volatility of the BlueFire fund relative to the S&P indexes. Though the total return is not as high as the benchmarks over this period, the fluctuation is far less — and the fund is performing as expected so far. Past performance is no forecast of future returns.

Investments involve risk and, unless otherwise stated, are not guaranteed. Information provided is for educational purposes only. Be sure to first consult with a qualified financial adviser and/or tax professional before implementing any strategy discussed herein. Past performance is not indicative of future performance.