Anyone Want to Join a Crisis?
- Many so-called crises move too slowly to be true tipping points for markets.
- About 43% of U.S. large and midcap stocks exceeded 25% year-over-year EPS growth as of 10/13/2026.
- Much of that growth comes from the largest AI-related stocks and energy companies, so some caution is warranted.
Geoeconomic crisis, misinformation and disinformation crisis, societal polarization crisis, climate crisis, cyber-security crisis, data-center crisis, water crisis, healthcare crisis, housing crisis, currency crisis, drug crisis, Covid crisis, education crisis, youth crisis, AI crisis, and finally the migration crisis are just a few. Which one would you like to join? I leave out the “pajama crisis” at airports these days where seemingly travelers have decided indecorum and boorishness should rule the day.
What Actually Counts as a Crisis?
I was raised to think that a “crisis” meant a situation where there’s no turning back from — where the system collapses under all the crisis weight. Surely, most of these do not deserve to be called a crisis, and even if serious, they move too slow to claim we’re at a tipping point. Some believe the solution is more government to assuage the ample emotions tied to the abundance of crises. France is center stage today for these extravaganzas, where they’re mirroring John Fogerty:
And of course, they’re asking the government for more, and in turn, governments like California are asking wealthy taxpayers for more. So, the Fogerty lyrics keep marching on like a perpetual motion machine.
The Limits of Government
Governments are only a partial and incomplete solution to crises, and these days many are over-involved entirely. They can’t afford what their myriad aims are attempting. Today, governments are heavily indebted and do not create wealth (though they do create money and inflation) to solve these issues in the first place. They consume wealth. Whatever taxes are raised, government has proven it will spend every cent and then some.
Government can and should, however, provide the infrastructure to allow businesses to grow, which in turn increases the size of the “pie,” thus enabling its citizens to grow their wealth and increase their income themselves. Outside of the US, we need only look as far as Ireland to see the substantial beneficial effects of pro-growth policies.
Pro-growth policies can cover a multitude of sins, which include fiscal and tax changes, education revamp, infrastructure improvements, decreasing regulations (at least removing redundancies), and stabilizing currency rates, thereby providing market liquidity. Anything moving the government toward more acceptance and belief in free markets will provide greater economic growth. The contrary view — that a few experts in government using coercion can lead us all to nirvana — is naïve and hasn’t worked well in history.
Through the cascading of individuals each pursuing their own objectives, an equilibrium is reached between supply and demand. Government’s role is to promote competition and fairness, aid the pursuit of individual goals, and limit as much as possible the interference of its own endeavors. These actions nearly universally lead to, and efficiently increase, economic growth.
Interestingly, sports has been the best example of the success of competition and free markets for centuries, where fairness (mostly) prevails by limiting governing bodies’ size, complexity and influence of outcomes. Nearly the whole world agrees about this. Yet many believe “directing” economies is the better way. How then is the average investor to make their way through this maze of confusion?
(to paraphrase 1992’s Mr. Carville)
The Exceedance Chart
The chart below is an “Exceedance” chart for earnings. It graphs the percentage of stocks within a specific universe that exceed the EPS growth rates on the horizontal axis. As we move from left to right across the bar chart, there are smaller and smaller percentages of stocks whose growth rates, measured across three different measures, exceed that of the EPS number.
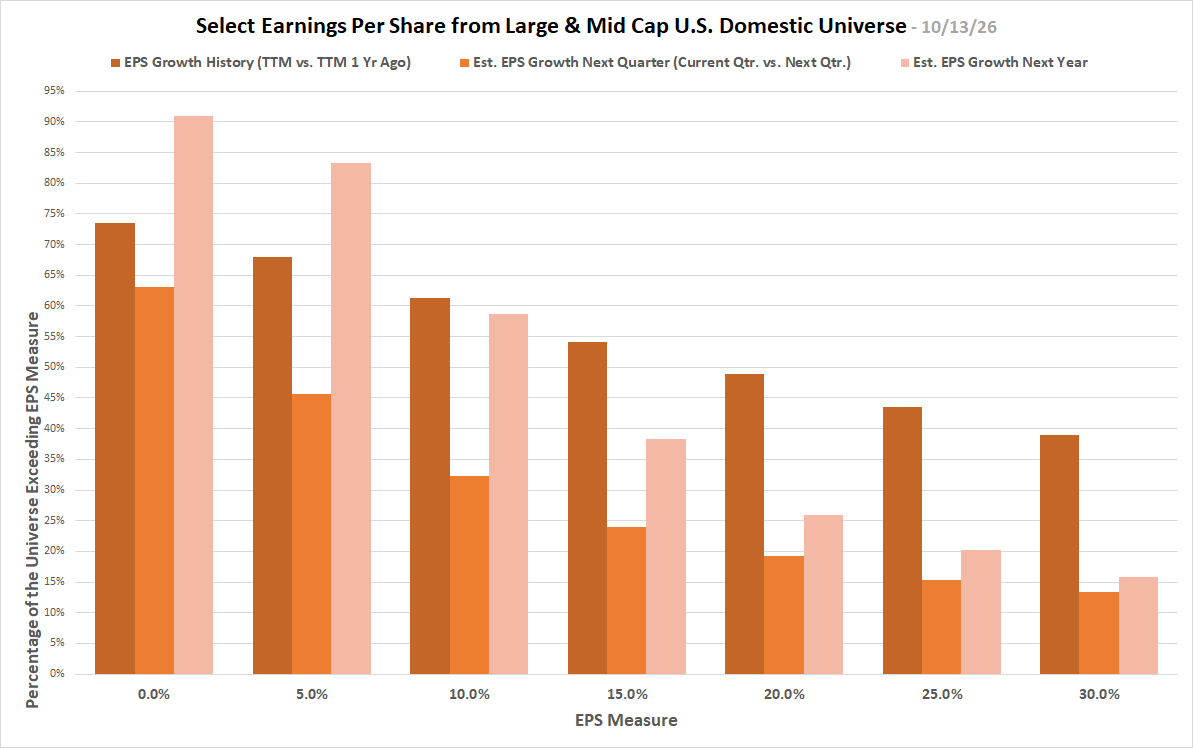
But, roughly 43% of stocks in the large and midcap U.S. domestic universe exceeded EPS growth of 25% year-over-year. This is a large percentage. While ~15% of the estimated EPS growth exceed 30% next year. Obviously, as the EPS measure increases, the number of stocks exceeding the “bogey” decreases. What the numbers relay to the intelligent investor is sure to boost confidence in continued success of the market, as those are near record earnings percentages.
The Broader Universe Averages
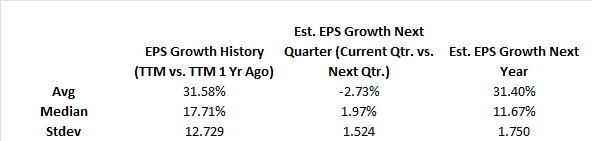
The 2nd chart displayed below offers the averages for this universe, chosen on 10/13/2026. If you consider that generally, the annual numbers (1st and 3rd columns) are so similar, it tends to bring confidence that as long as the current conditions remain as they are, the near trend of the market will be stable — and robust. The middle column speaks to this quarter vs. next, and the changes are small, indicating little difference in earnings in the short term.
How BlueFire Navigates It
At BlueFire, our actively managed process spreads the risk evenly across all stocks while applying our passive risk constraints, mirroring the S&P’s sector weights and highest-weighted holdings in the index. We thus partake in the movers and shakers of the market while assuring greater diversification and lower firm-specific risk than the market.

Investments involve risk and, unless otherwise stated, are not guaranteed. Information provided is for educational purposes only. Be sure to first consult with a qualified financial adviser and/or tax professional before implementing any strategy discussed herein. Past performance is not indicative of future performance.