What’s in a Low Volatility Portfolio?
How BlueFire Selects Securities
One of the contributions to how the BlueFire Large Cap Fund, L.P. portfolio selects securities for the fund is by leveraging the output of a model designed through research using Growth, Quality, Sentiment, Stability, and Valuation categories. This model, fully employed at Charles Schwab & Company through their QORE Analytics® program, assigns 5 ratings to stocks from “Strongly Outperform” through “Strongly Underperform.” One of us at BlueFire Strategies, LLC — the portfolio management company of the Fund — had spent many years managing the research group at Schwab where the model was created and maintained.
In addition, individual stock reports using these Schwab ratings also offer ratings opinions from CFRA, Morningstar, Argus, Reuters and Market Edge. The broker-dealer through which the BlueFire fund trades (Interactive Brokers) also offers analyst ratings of Buy, Hold and Sell. Collectively, all these views are combined to offer a holistic “market expectations” perspective that the management team at BlueFire leans on to help select securities for the fund. The process is mostly automated but there is a normal element of human oversight and sometimes disagreement with ratings.
Nevertheless, what is most common among these views falls upon individual factors based on the financial fundamentals of balance sheet, cash flow statements and income statements, along with a smattering of more complex functions based on price movements. In the end, it is the financials of individual companies and their historical relationships with stock returns — studied extensively to remove spurious effects — that lead security selection for the BlueFire Large Cap Fund, L.P.
Factor Indexes as a Benchmark
S&P Dow Jones Indices offers single-factor constructs that enable investors to compare exposure to non-market risk factors. This contrasts with examining a broad index for its risk, where multiple factors contribute and where distinguishing any one factor’s contribution is quite difficult if not impossible. Their factor categories cover Momentum, Growth, Beta, Quality, Low Volatility, Value, and so on. From their website one can look up the performance of these factors and use them for comparisons — where, of course, past performance is no guarantee of future results. It is a descriptive analysis of the past, but as useful as measuring the height of your children while they’re growing. Comparative but less predictive — however it helps us as managers to see if the BlueFire fund is behaving as expected. And it is.
The chart below is a plot of these factors’ performance taken from the S&P Dow Jones website, where we plot the quarter-to-date returns vs. the month-to-date returns for several of these factors along with the BlueFire Fund’s performance over the identical time period. The performance numbers are the excess returns over and above (or below) the S&P 500 Index returns, measured quarter-to-date and month-to-date.
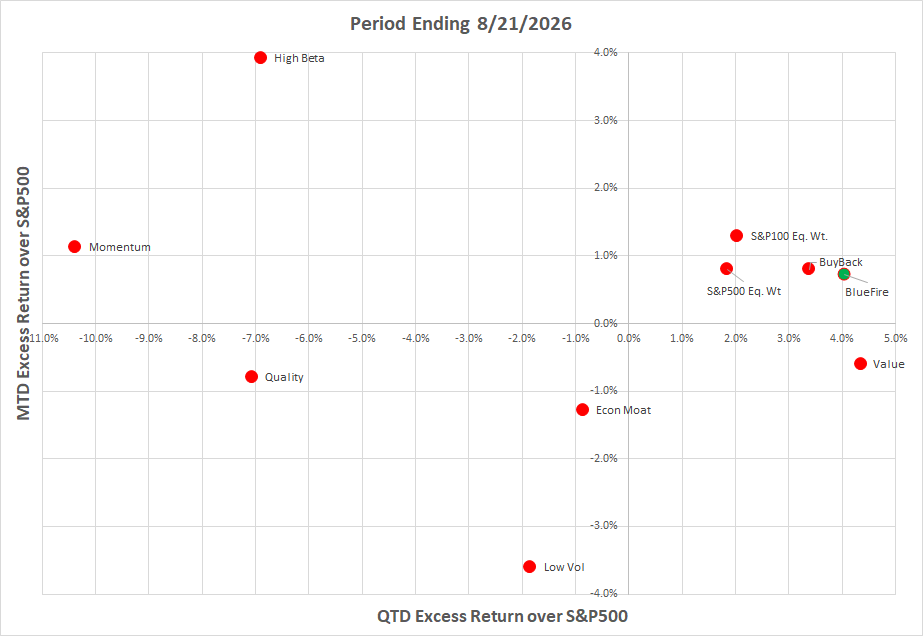
Note the Low Volatility factor portfolio in the middle-bottom of the chart, labeled “Low Vol.” Its QTD relative return to the S&P 500 is −1.8% while its MTD excess return is −3.6%. It has not done well most of this year. There are a cluster of portfolios/indexes within a small range of ~1% month-to-date excess returns, and a few had positive quarter-to-date returns between ~2% to 5% — including BlueFire.
The BlueFire fund is a multi-factor Fund due to the nature of its security selection, weighing many factors to decide which stocks enter the portfolio. More importantly, the way it constructs the portfolio using risk-parity algorithms makes it in some sense a type of low volatility portfolio — but a very different type than a standard low-volatility portfolio, as the chart above clearly illustrates.
BlueFire vs. Standard Low Volatility: A Different Animal Entirely
Typically, there are only about a dozen stocks common to both BlueFire and the Low Volatility portfolio. The SPLV ETF starts with the S&P 500 stock universe, selects the 100 stocks with the lowest individual volatility, then weights those stocks inversely proportional to each stock’s volatility. Sector weights are just the outcome of that process, not specifically targeted, and can be — and usually are — very different from the index.
The BlueFire portfolio starts with a bigger universe of large-cap stocks (~1,000) and selects between 300 to 350 of the highest quality, lower valuation and volatility, with increasing investor interest for a first screen. A second screen commences, sorting by their cross-correlation lowest to highest, then starting at the lowest cross-correlated stocks builds a portfolio of roughly ~100 equities, adding securities while targeting the sector weights of the S&P 500. Finally, risk-parity optimization is done so that all stocks are held at weights which equalize their volatility/risk while maintaining nearly the sector weighting of the S&P.
Starlings, Not Cats
The way to think of this: BlueFire expects a portfolio of stocks to act like a school of fish or a murmuration of starlings — where when a few birds change direction, the whole flock starts drifting with it. They exhibit collective behavior. Given that, BlueFire’s portfolio construction process seeks to create a portfolio to offset this collective behavior so that when a few stocks retrench and move downward, or the market sells off, fewer stocks in the portfolio move with the sell-off, as each acts more independently.

Standard low-volatility strategies build a portfolio of stocks treating them like a group of cats — each acting toward its own goals, finding its own food and sleeping alone. But this isn’t reality. Stocks are indeed correlated, and the low volatility index takes no effort to account for it. So the natural collective behavior of equities works against the portfolio should the market sell off, bringing the index with it.
The BlueFire Large Cap Fund, L.P. is indeed unusual compared to anything else. The structure of the fund and its methodology uses the fundamental nature of stock correlation as something to leverage and count on, versus other low volatility strategies which mostly ignore it. Additionally, BlueFire does not take large sector weight exposures too different from the S&P 500 — while other low volatility portfolios could be completely out of a sector or two that the S&P 500 index owns. Hence, their returns can stray away from the index significantly, while the BlueFire portfolio by construction is more likely to have returns nearer the index while maintaining low volatility and higher Sharpe ratios over time.
Factor & Index Definitions
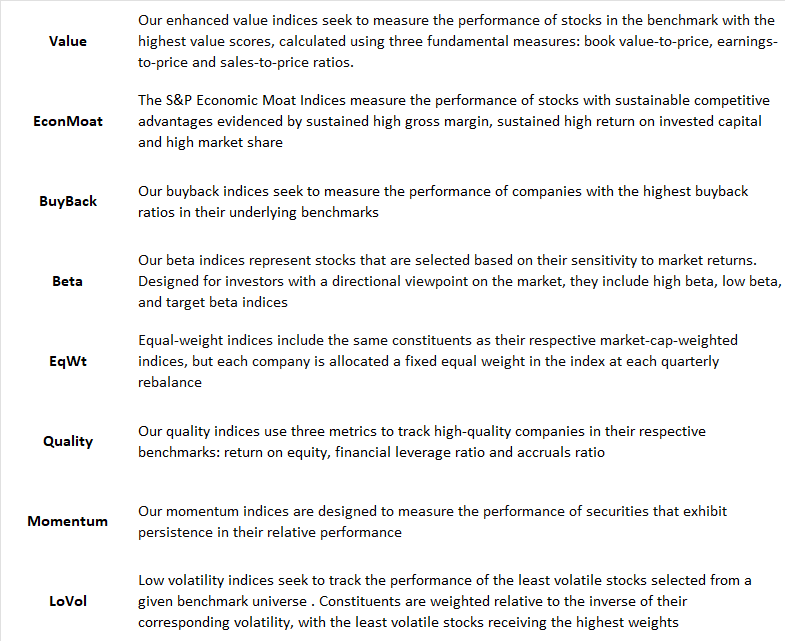
We list the definitions of the factors and indexes in the above chart from S&P Dow Jones at their website, below.

Investments involve risk and, unless otherwise stated, are not guaranteed. Information provided is for educational purposes only. Be sure to first consult with a qualified financial adviser and/or tax professional before implementing any strategy discussed herein. Past performance is not indicative of future performance.